Learn dashboard design with me
Most dashboards show numbers and leave the reader to work out what they mean. The people who solved that problem were drawing railway timetables, mountain maps, control panels and trade accounts long before there were screens.
This guide puts their answers to work. It starts with who they were, turns what they found into twelve rules, each with a model you can change, and ends with the dashboards we built that way. It reads as one page: keep scrolling and each chapter follows the last.
The people behind the rules
The people the rules cite, in the order of their work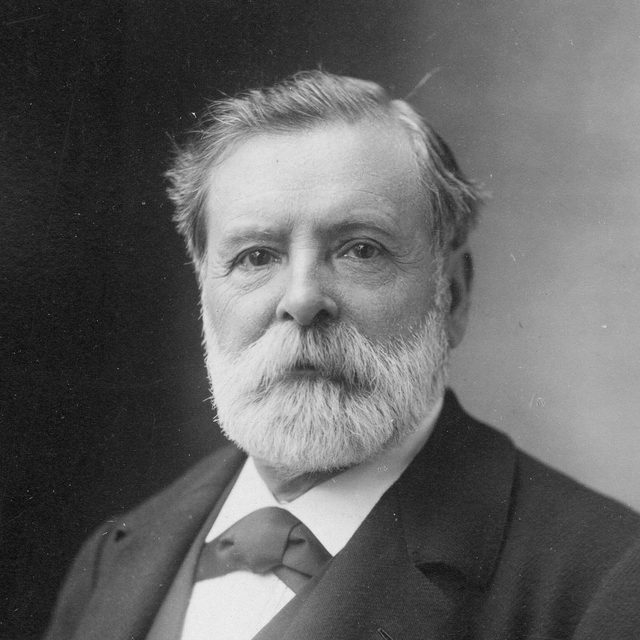 Étienne-Jules Marey1878 · La Méthode graphique
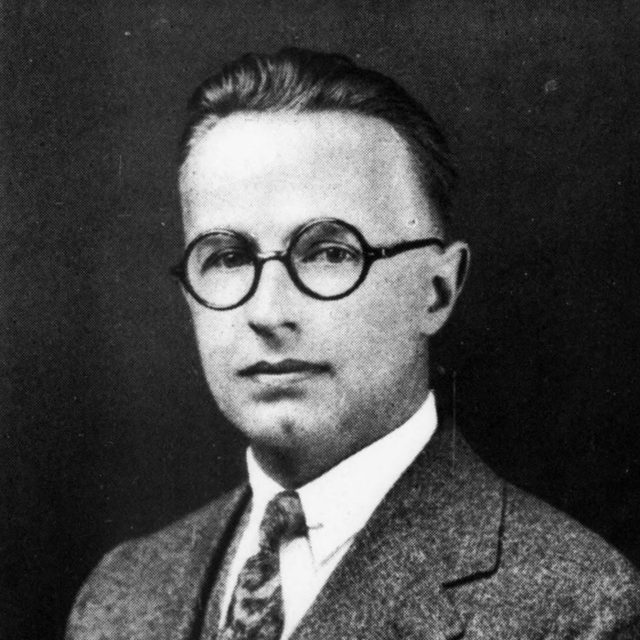 Walter Shewhart1924 · The control chart
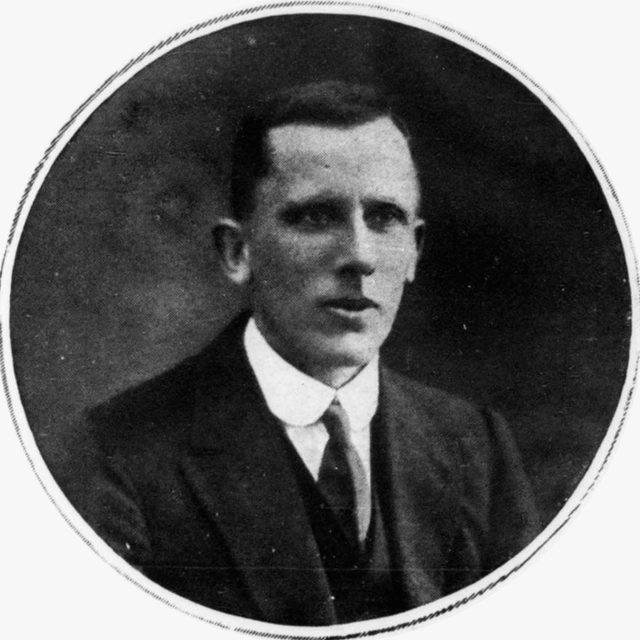 Ernest Gowers1948 · Plain Words
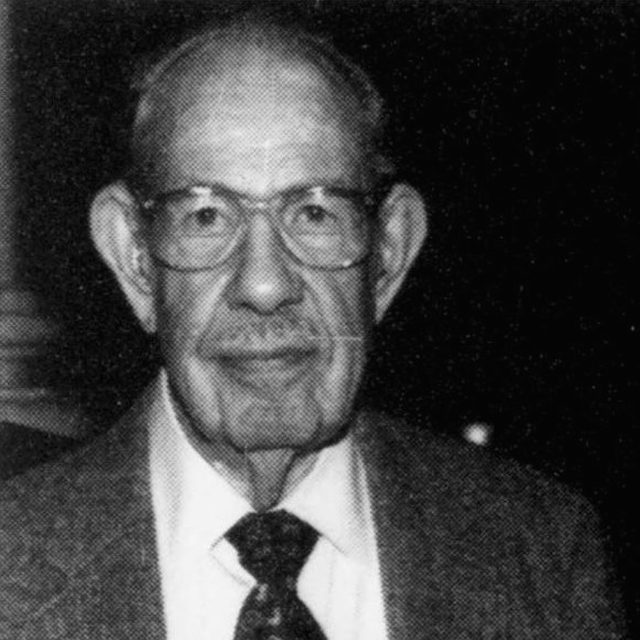 Arthur Robinson1952 · The Look of Maps
 Adrian Frutiger1957 · Univers
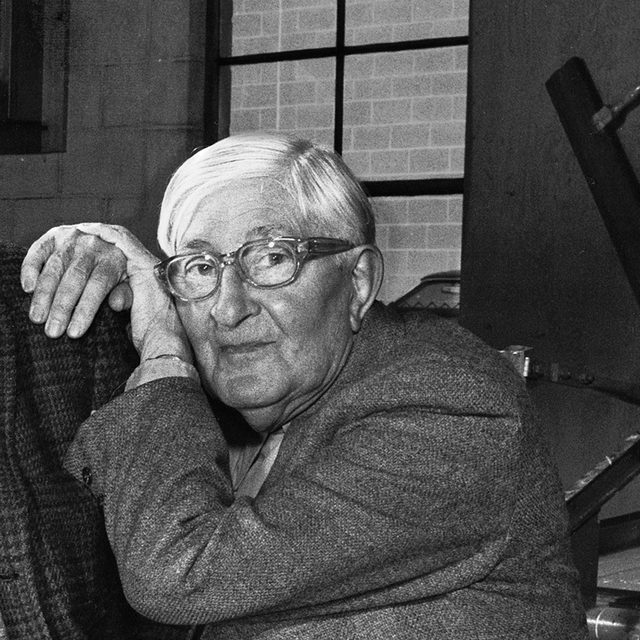 Josef Albers1963 · Interaction of Color
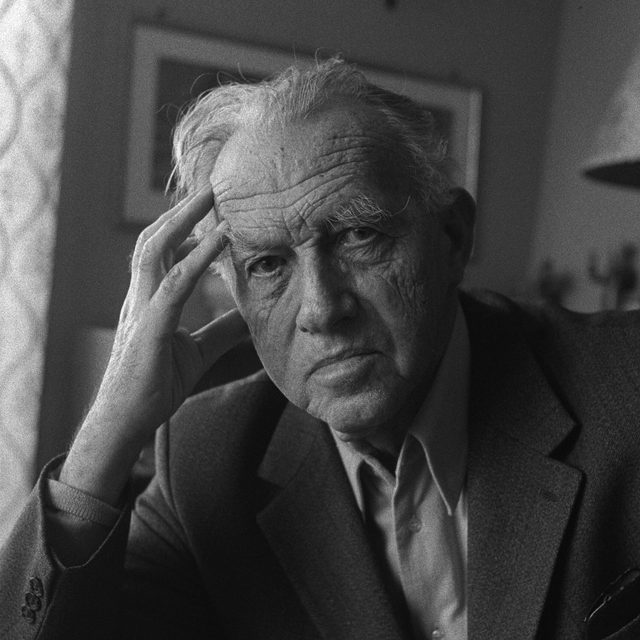 Eduard Imhof1965 · Cartographic Relief Presentation
 Jacques Bertin1967 · Semiology of Graphics
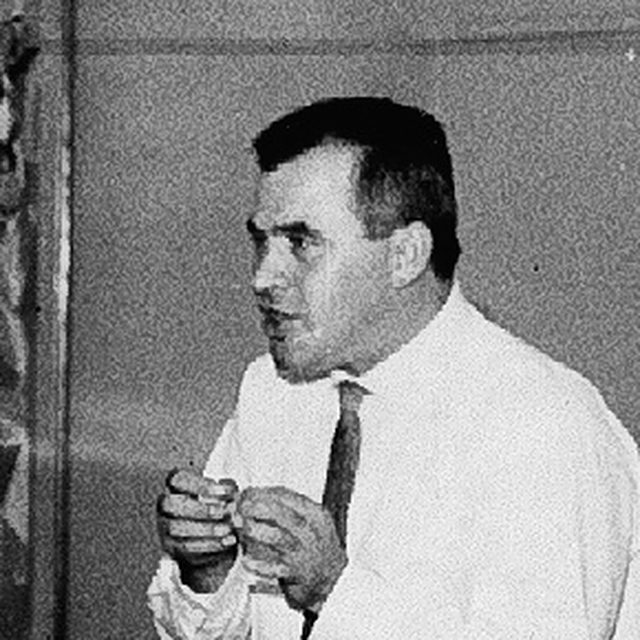 Otl Aicher1972 · Munich Olympics
 Wim Crouwel1977 · Dutch telephone directory
 Massimo Vignelli1977 · Unigrid
 Andrew Ehrenberg1977 · Rudiments of numeracy
 Matthew Carter1978 · Bell Centennial
 Josef Müller-Brockmann1981 · Grid Systems in Graphic Design
 Edward Tufte1983 · The Visual Display of Quantitative Information
 Ben Shneiderman1994 · Dynamic queries
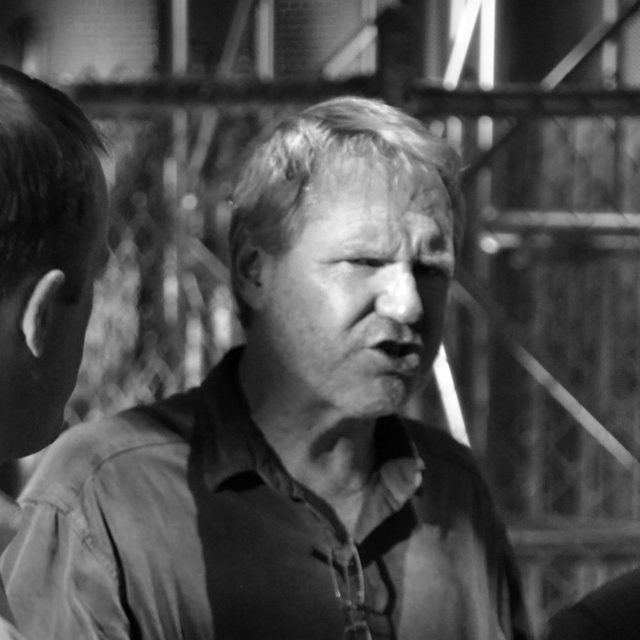 Stephen Few2006 · Bullet Graph Design Specification
 Bret Victor2011 · Explorable Explanations
 Jeffrey Heer2012 · Interactive Dynamics for Visual Analysis
 Tamara Munzner2014 · Visualization Analysis and Design
One dashboard, twelve rules
Point at a rule to find it on the pageA small dashboard for an imaginary business, built with every rule in this guide. Each region answers one question and sits on the same twelve-column grid. Point at a rule to see where it works on the page, or at a region to see which rules it uses. The chapters then open the rules one at a time.
Contents
Keep scrolling to read them in order, or open any one- 1
The people
Who worked out how to draw numbers that people act on, what each of them made, what they brought to the craft, and what to take from them.
Inside54 people in six fields, on one time axis - 2
Frame and measure
A grid that divides many ways, an instrument for every number, and a test for when a change is real.
InsideRules 1, 2 and 3 - 3
Marks and surfaces
Draw the arithmetic as a shape, shade for hierarchy and print the quantity, and give each fill one job.
InsideRules 4, 5 and 6 - 4
Reading order
One axis shared down the page, tables set to be read, and type chosen for figures.
InsideRules 7, 8 and 9 - 5
Candour and control
Uncertainty shown only when it is earned, each control placed on its consequence, and plain words for every number.
InsideRules 10, 11 and 12 - 6
What neighbouring fields know
Forecasting, business notation, retail planning, tables, perception, control rooms, research on dashboards and type, each read for what it found.
InsideEight fields, with charts drawn from published results - 7
Dashboards we made
Our dashboards opened up: the question each one answers, who reads it, and the rules that carry it.
Inside7 dashboards, 40 annotations - 8
Works to open
Books, papers, interfaces and working tools that are worth studying whole.
InsideOn paper, on screen and in working tools - 9
The system
The grid, tokens and type the guide is built from, a model to tune them, and every source and credit.
InsideTokens to copy, sources, photo credits